Insights
Automatic Insights: See how content performed and unlock outliers in partnership earned media value. Insights reports are delivered automatically based on the selected timeframe (weekly or monthly). Blinkfire Dashboard is another report that offers real-time insights
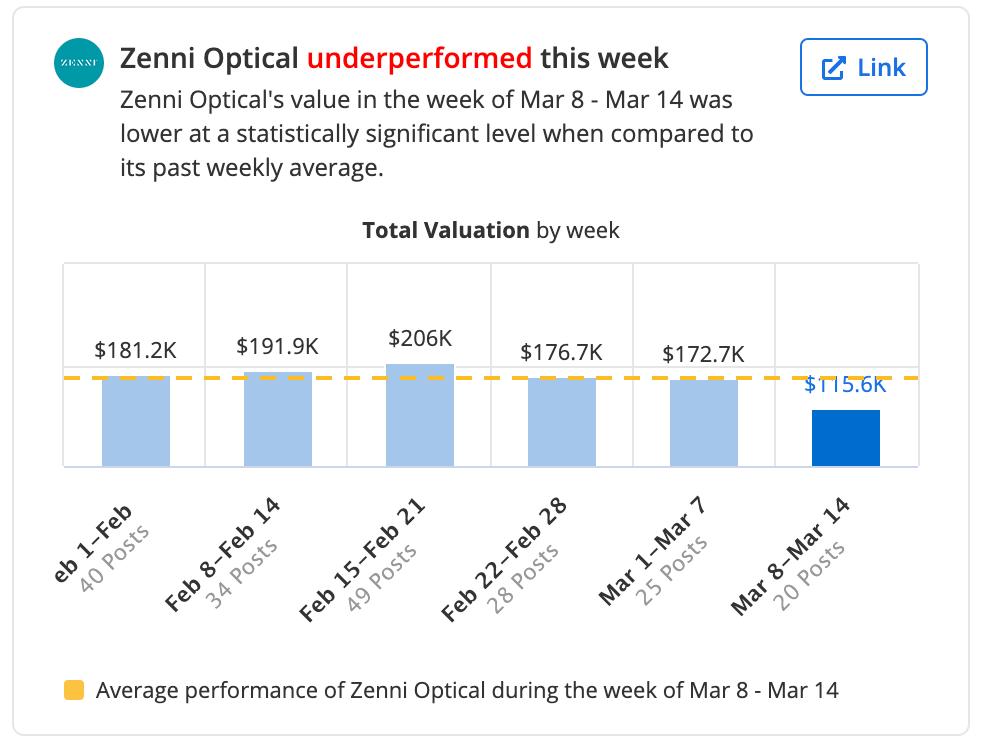
Over & underperforming brands
Over and underperforming brand insights show the brands where the earned media value deviated significantly from the mean compared to past performances. Did a brand underperform versus other weeks and why? Was a brand on more content than normal and received a higher earned media value?
An example of Insights for the Chicago Bulls. This weekly report looks at data from March 8 – 14, 2021. Zenni, the Bulls’ jersey patch partner, saw its earned media value underperform compared to the five weeks prior. This insight widget also links directly to the posts.
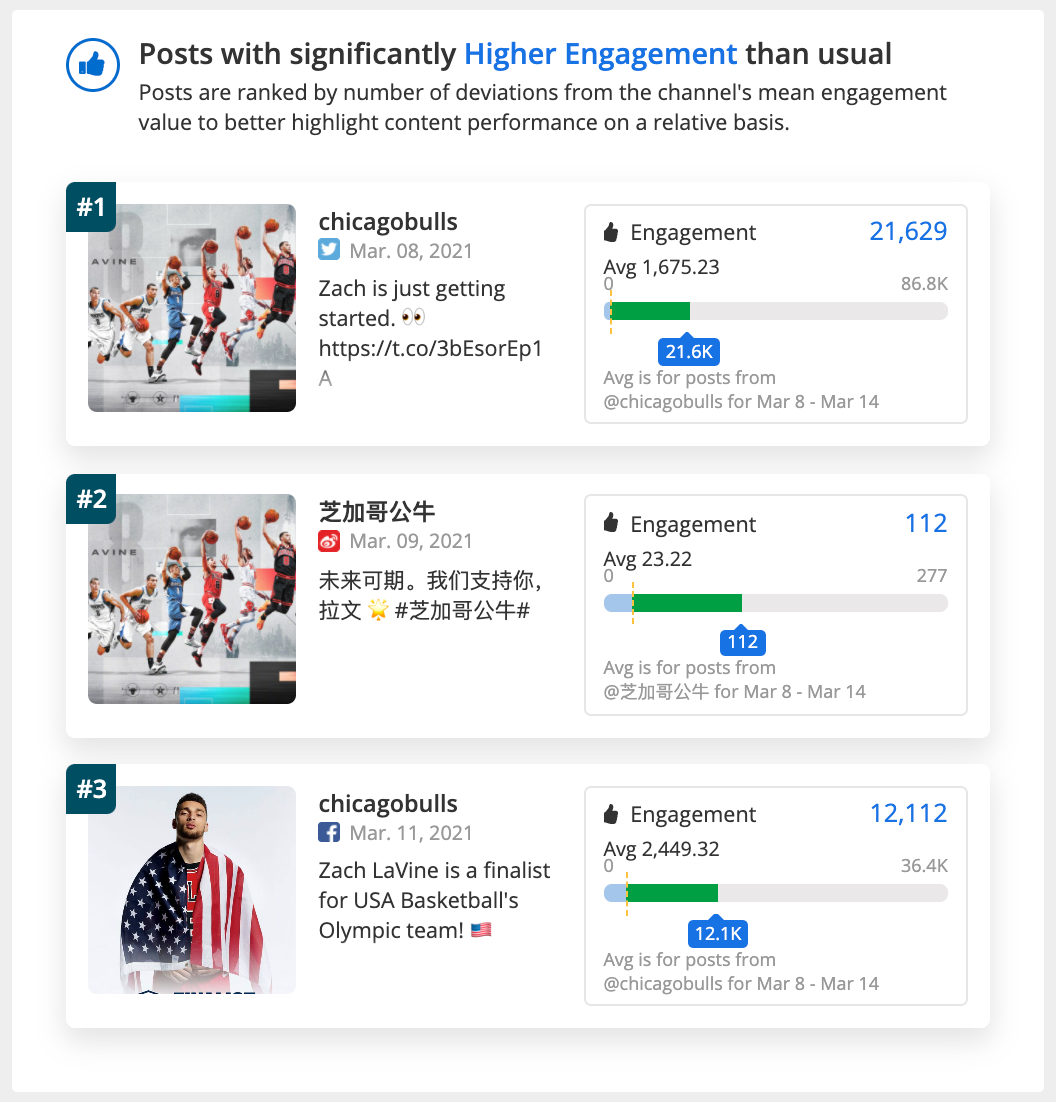
Post with higher (or lower) than normal engagement & impressions
This insight highlights content performance on a relative basis. This means the top three posts returned deviated the most from its channel’s mean. Keep in mind that this insight will not always return the posts with the highest engagement or impressions. (Note: impressions data is private, and only viewable to the owned and operated entities.)
The top three posts from the Chicago Bulls with higher than normal engagement were from Twitter, Sina Weibo, and Facebook. This insight highlights performance oddities.
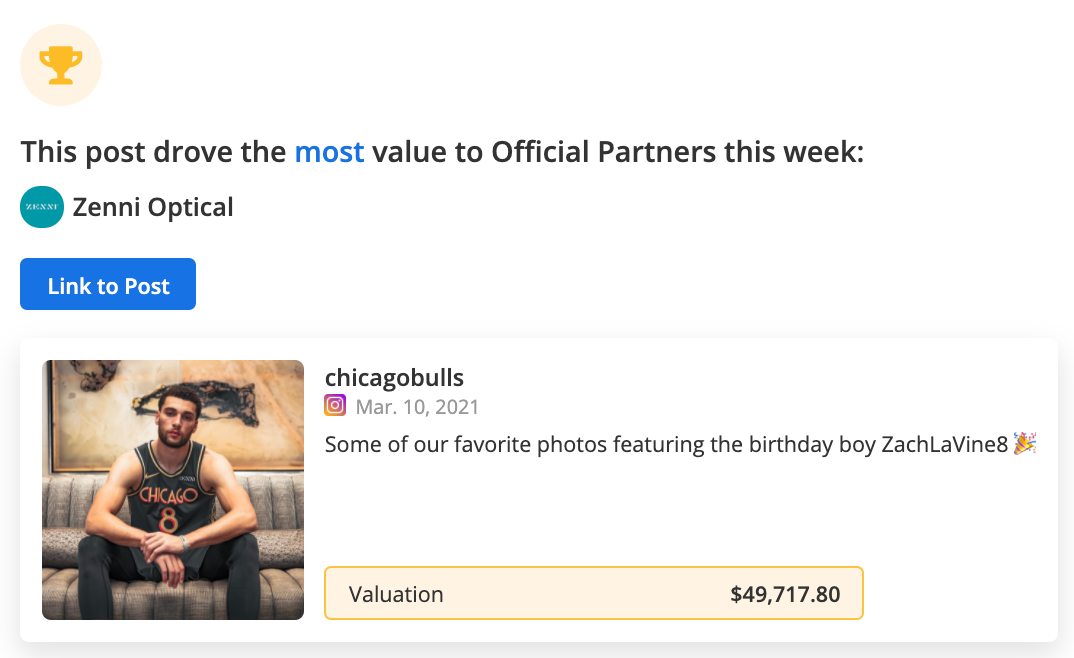
Earned media value – the post driving the most value for an official partner
This insight shows the post with the largest media value for an official brand partner.
This Bulls’ Instagram post earned Zenni the most value of all posts published from March 8 – 14, 2021. Also, the post can be shared within the organization or directly with Zenni. Win-win.